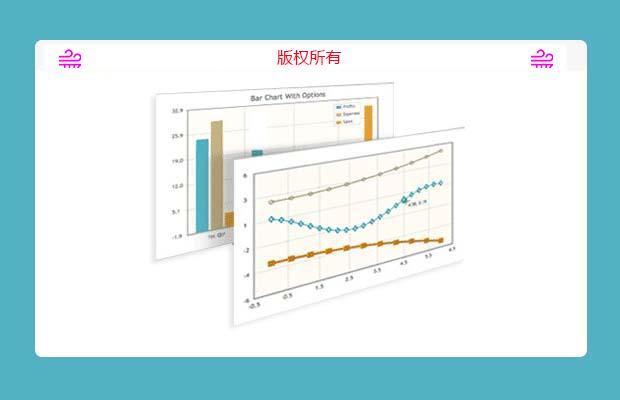
插件描述:jqPlot是一个jQuery绘图插件,可以利用它制作漂亮的线状图、柱状图和饼图。
例如js代码:
1 2 3 4 5 6 7 8 9 10 11 12 13 14 15 16 17 18 19 20 21 22 23 24 25 26 27 28 29 30 31 32 33 34 35 | $(document).ready(function(){ var line1 = [6.5, 9.2, 14, 19.65, 26.4, 35, 51]; var plot1 = $.jqplot('chart1', [line1], { legend: {show:false}, axes:{ xaxis:{ tickOptions:{ angle: -30 }, tickRenderer:$.jqplot.CanvasAxisTickRenderer, label:'Core Motor Amperage', labelOptions:{ fontFamily:'Helvetica', fontSize: '14pt' }, labelRenderer: $.jqplot.CanvasAxisLabelRenderer }, yaxis:{ renderer:$.jqplot.LogAxisRenderer, tickOptions:{ labelPosition: 'middle', angle:-30 }, tickRenderer:$.jqplot.CanvasAxisTickRenderer, labelRenderer: $.jqplot.CanvasAxisLabelRenderer, labelOptions:{ fontFamily:'Helvetica', fontSize: '14pt' }, label:'Core Motor Voltage' } } });}); |
并引用在html引用:
1 2 3 4 5 6 7 8 9 10 | <script type="text/javascript" src="../jquery.jqplot.min.js"></script><script type="text/javascript" src="../plugins/jqplot.logAxisRenderer.min.js"></script><script type="text/javascript" src="../plugins/jqplot.canvasTextRenderer.min.js"></script><script type="text/javascript" src="../plugins/jqplot.canvasAxisLabelRenderer.min.js"></script><script type="text/javascript" src="../plugins/jqplot.canvasAxisTickRenderer.min.js"></script><script type="text/javascript" src="../plugins/jqplot.dateAxisRenderer.min.js"></script><script type="text/javascript" src="../plugins/jqplot.categoryAxisRenderer.min.js"></script><script type="text/javascript" src="../plugins/jqplot.barRenderer.min.js"></script><link rel="stylesheet" type="text/css" hrf="../jquery.jqplot.min.css" /> |
特别申明:
本站所有资源都是由网友投稿发布,或转载各大下载站,请自行检测软件的完整性!
本站所有资源仅供学习与参考,请勿用于商业用途,否则产生的一切后果将由您自己承担!
如有侵权请联系我们删除下架,联系方式:lei1294551502@163.com
- 上一个特效: 可拖拽进度条
- 下一个特效: 常用鼠标经过遮罩层动画效果